The best way for your team to use Playwright
Fast, easy and reliable end-2-end testing for modern web apps
Get a beautiful dashboard
Using our dashboard, you and team can collaborate, analyze and quickly view all your test results in one beautiful dashboard. You can share your dashboard with your team and get feedback from your testers.

Unified report for your sharded tests
Understand your test runs immediately in Playwright Dashboards Unified report. You will quickly figure out where the issue is happening with the stack trace, or get a visual understanding of the problem with video replay and screenshot.
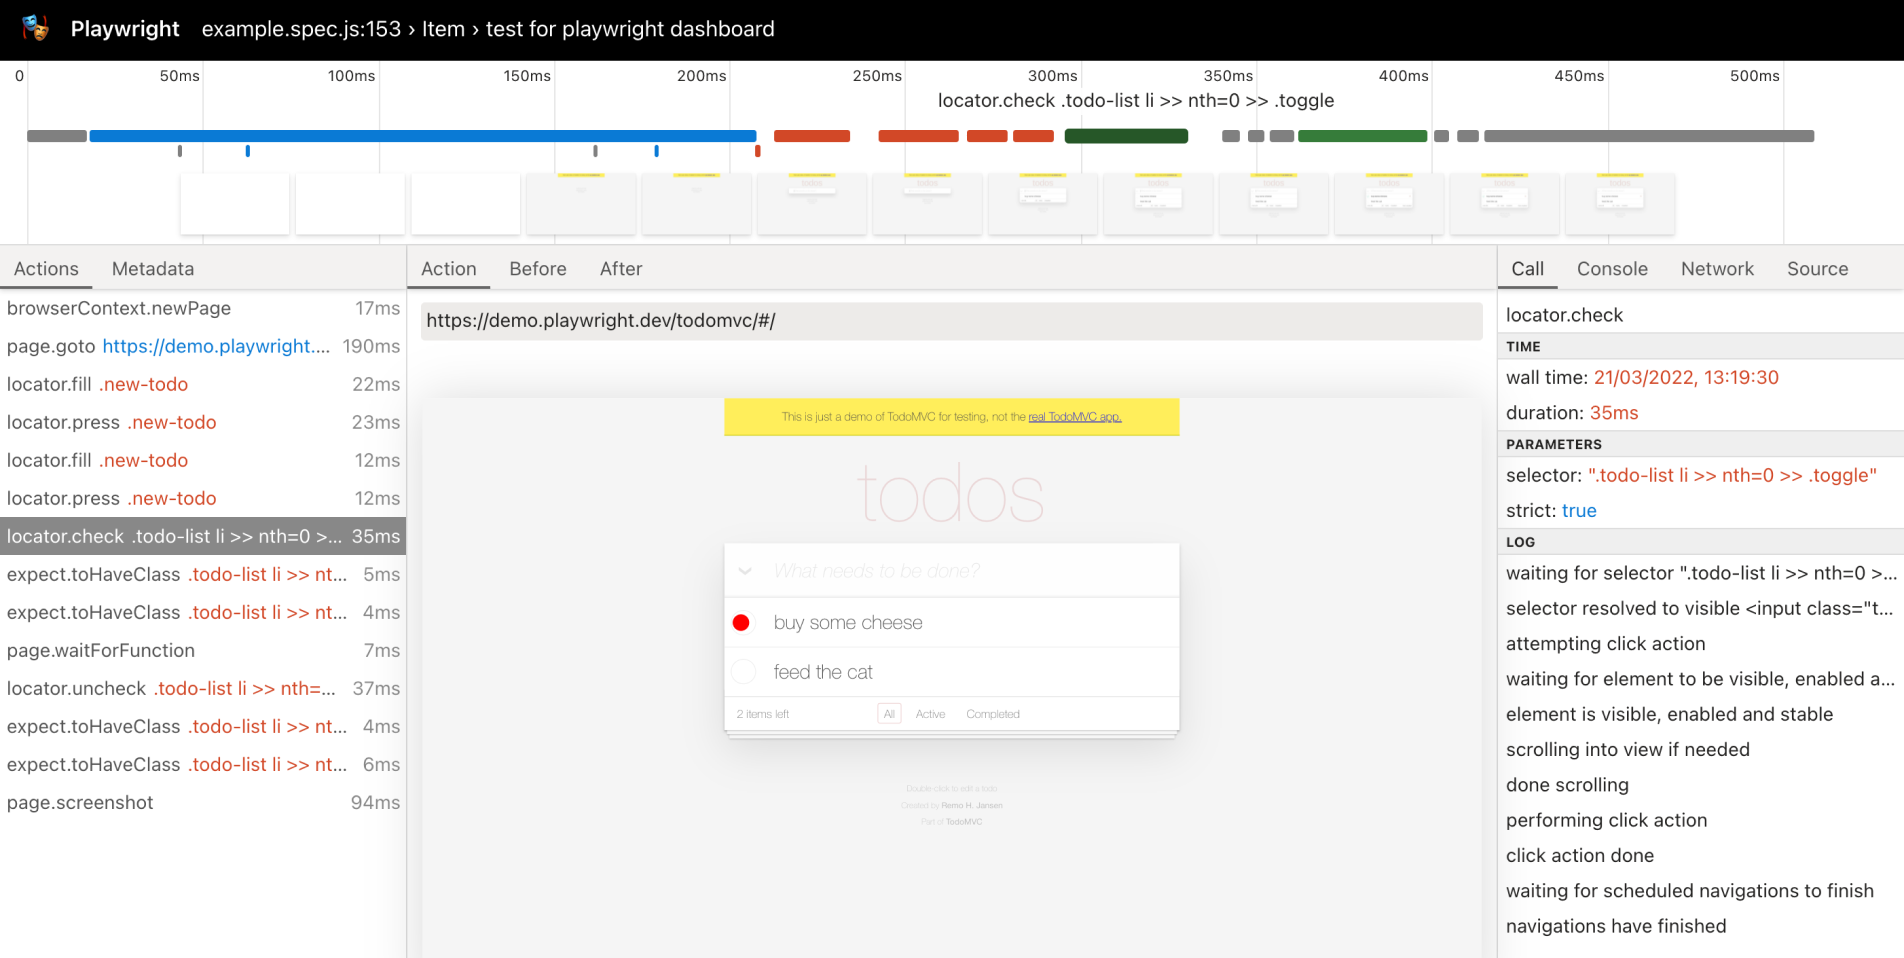
Get to exactly where your tests failed
Get all the information to investigate the test failure. Playwright Dashboard will give you a trace viewer that contains test execution screencast, live DOM snapshots, action explorer, test source, and much more.
Notify your team when your tests fail
With the Playwright Dashboard Slack integration, we provide you a real-time view of your Playwright Dashboard tests, all in one place — improving remote collaboration and giving wider visibility into test behavior.
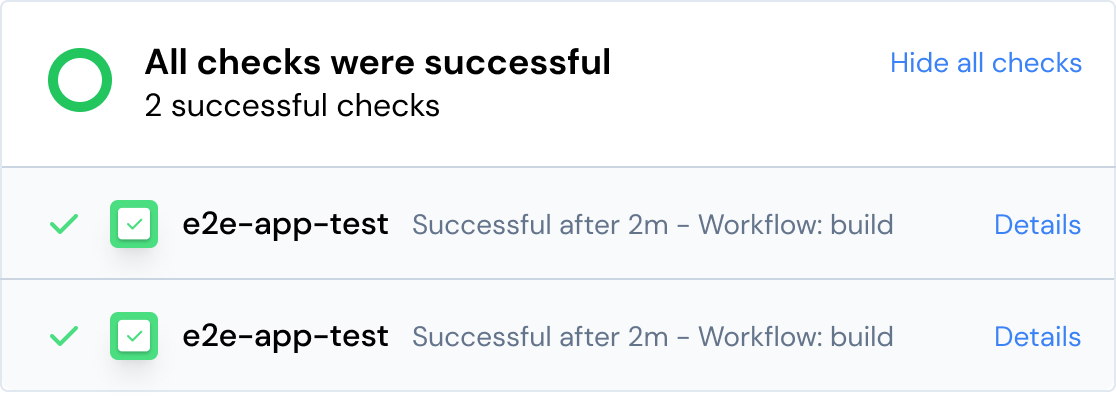
Merge confidently with GitHub Status Checks
Playwright Dashboard nicely integrates with your GitHub workflow via commit status checks and pull-request comments. This gives you the confident to merge your PRs, and the ability to see the status of your Playwright tests as they run.
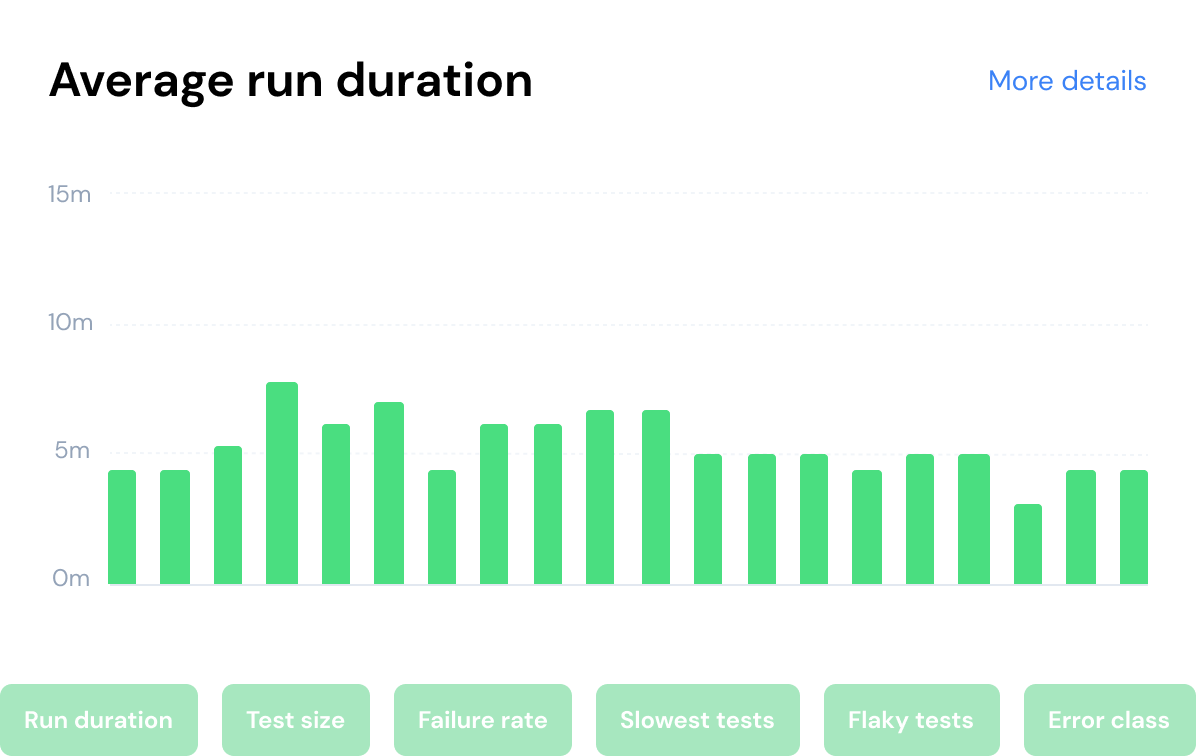
Get instant insight into your tests
From our dashboard, you will be able to get a good overview of how your tests are performing. How much is the test duration increasing over time? How flaky are the tests? When did they get flaky? How large are the tests? What type of class of errors are we seeing often?
You’re in good company
Here's what our users have to say about Playwright Dashboard
Plugs right into your existing workflow
Playwright Dashboard is really easy install and integrates with your existing workflow. Simply get our Playwright reporter and add it to your existing Playwright test runner.
npm i playwright-dashboard
1 package downloaded successfully in 1s
> npx playwright test --reporter playwright-dashboard
playwright-dashboard@1.0.0 starting tests...

© 2022 Playwrightdashboard.com - All rights reserved.